
6. Bruker TruLive3D Experiment
This page will guide through the steps to set-up a basic experiment.
1. Setting up an experiment
You have many possibilities to set-up an experiment with the Bruker TruLive3D. You can record a single z-stack at several time points, multiple z-stacks at several time points and you can also acquire bigger areas than the field of view by tiling the images together.
You can acquire data in a single channel with one or multiple laser lines on and simultaneously acquire images for two different emission channels, or you can create several channels for each laser line.
NOTE: if you only need one camera to acquire your images make sure you turn off the other one in the camera panel (unlink them and turn one off) otherwise both cameras will capture images which doubles the size of your data.
CHANNEL:
- Create a channel. This will have all the current savings on the screen: laser lines and power, beam expander setting, detection filters, camera settings. If you change a setting, remember to update the channel.

Z-STACK:
- Create a z-stack. Move the Z stage until you find the stack you want. At the bottom of the stack, click on the arrow in the z-stack parameter to update the value read on the stage control panel. Then go to the top of the stack and repeat the process. To visualize the data, the z-stack panel has buttons to go directly to the middle, bottom or top of the stack.

EVENT and TASKS:
- Create an event. This will open two other panels with tasks and trigger. Set up your task(s) with the channel(s) you want and the z-stack(s) you want. You can have the same channel for all the different z-stacks or different channels with different z-stacks.
TRIGGER:
- Set-up your trigger. This defines the parameters for the timelapse.

SAVE YOUR SETTINGS:
- Select where you want to save your data. If you are saving your data locally, create a folder for your Group in the Disk D and select this folder.
- Follow the procedure taped on the wall to name your data: Lab_Initials_Date_DataDetails
- ALWAYS save your settings for future use. Make sure you save those settings in your folder.
- If you are saving directly on your server select it as a location. We do not recommend this though as the connection may drop during acquisition. To be able to save directly on your server you must ask the Beckman Center admin to set it up.

- Click Run when everything is ready!
- When you experiment is done please refer to the Data management page to follow the procedure to transfer and delete it.
LuxBundle saving process:
-
- LuxBundle creates a new experiment folder in the folder where you save your data. This folder has a specific timestamp following this convention: year_month_day_hoursminuteseconds. For example, if an acquisition is launched on December 13, 2023 at 3:19:26pm then the timestamp will be 2023_12_13_151926.
- Inside the timestamp folder, sub-folders are created for each stack and channel combination. The folders are named stack_(n)_channel_(n). For example, if you acquire 3 z-stacks with a single channel you will have 3 sub-folders named stack_0_channel_0, stack_1_channel_0, stack_2_channel_0.
- If you acquired tiled montage acquisitions, the stack sub-folders will include the X and Y coordinates of each tile position such as stack_0_x00_y00_channel_0, stack_0_x00_y01_channel_0 and so on.
- Within each sub-folder, the image data for each stack is written as Cam_Long_00000.h5 and Cam_Short_00000.h5 files. For time series, the h5 files include the time points such as Cam_Long_00001.h5 and Cam_Long_00002.h5 etc. The h5 files can be opened in FIJI, they are open source format.
- LuxBundle also creates files that contain the metadata for each experiment. Those are the JSON files that can be opened in Notepad. They contain the microscope settings.
SPECIAL CASES:
- When you set an experiment with several events and stacks of different sizes with different timepoints (triggers), the data will save properly but the bdv and ims header files will not write properly. When you see an error message telling you this, you know that you will need to post-process the data to generate those header files. This can be done in the Image Processor and is explained below. Follow the instructions to create separate ims and bdv header files. Make sure you process each stack separately as a different task.
2. Visualize your data
- Click on image viewer

The image viewer in LuxBundle allows you to visualize the data frame by frame. It is not a 3D viewer, unlike Imaris viewer, but can give you an idea of what happened during your experiment at each time point. You can also play a movie of the z-stack. When you open the image viewer you can select the image data you want.


3. Process the data
Finally, LuxBundle has an image processor function that allows you to do a few things to process your data. Click on the LuxProcessor tab.
For a complete overview of the capabilities of the Image Processor, please read the User Guide located in the little book icon on the top right corner of the LuxControl window.


When your data is acquired, it automatically creates an imaris (.ims) header file along the Fiji Big Data viewer (bdv.h5) header files. However, depending on the size of your data set loading the images in imaris can take a very long time.
It also creates an ims folder where you can find the ims headers for the different stacks you acquired. The raw folder contains the raw data.
NOTE: As of May 2024, the ims headers created display the channels in opposite orientation making it impossible to visualize the two superimposed.
The image processor enables you to process your data stack by stack and create separate imaris header files. It also creates a mip folder with the maximum intensity projection of each stack. This can be useful in some cases to gather a quick view of the experiment and see if it looks good.

Here, we will guide you through the steps to perform this task. For more information and potential debugging please refer to the User Guide in LuxBundle. You can also download the PDF version to read offline. And always ask the Beckman Center staff for guidance or in doubt!
- Add a new Task in the Tasks panel
- In the Task Configuration panel Name your new task and then click on Input.


- Browse through your data to select the image folder that you would like to process.

- If you only want to process a few stacks then de-select the ones you don't want.

- Click on the Registration tab and turn it off.

- Click on the Fusion tab and turn it on. You don't need to change any settings here.

- Click on the Output tab and select "Separate" on the "Bounding boxes" option. Width and Height of 1 will be full resolution images. If you want this processing step to go faster and you are willing to low some image quality you can down sample by choosing Width/Height greater than 1 and Depth greater than 1 as well.

BigTIFF: If you want to save your data as TIFF files, check the box for "Copy images to BigTIFF".
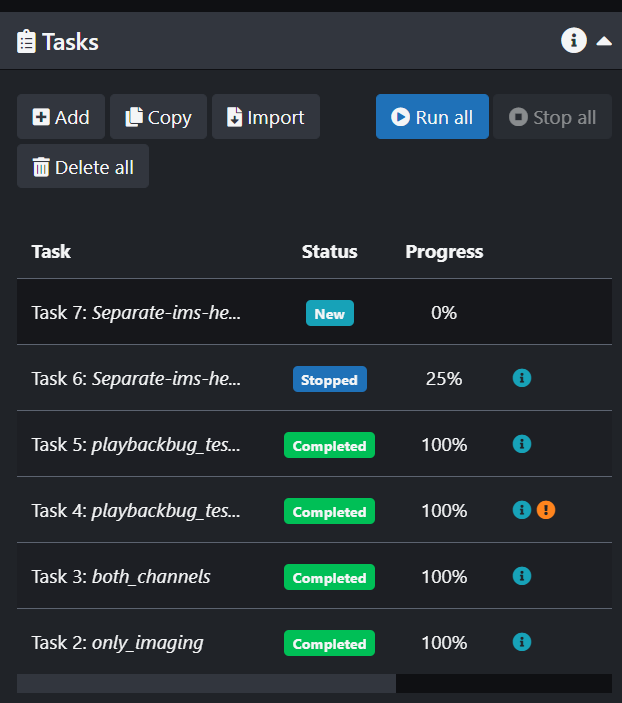
- The next step is to run the Task. Go back to the Tasks panel and scroll to the right then click on the arrow and click run. You can also stop or delete the task in this menu.
![]()
- IMPORTANT: if you want to have a separate processed folder for each stack, simply process the stacks separately. Create one task for each stack and then click "run all" to process all the stacks in one go.
- When you go to your image folder you will now see a "processed" folder that contains the separate imaris headers and the task configuration parameters as a JSON file. It also contains the mip folder.


No Comments