Bruker TruLive3D Data visualization in Fiji
The data generated by the Bruker TruLive3D contains a Fiji header named bdv.h5.
Fiji is an open source software that can be very powerful to view, process and render your data. You should really explore its possibilities!
When you install Fiji (ImageJ) it comes with plugins and one of them is called BigDataViewer. This plugin has been specifically built to deal with Light-Sheet data. It will open the bdv.h5 file and allow you to visualize your stacks, plane by plane.
Fiji actually has an excellent documentation page on their website which I highly recommend reading and experimenting with!
Fiji BigDataViewer documentation
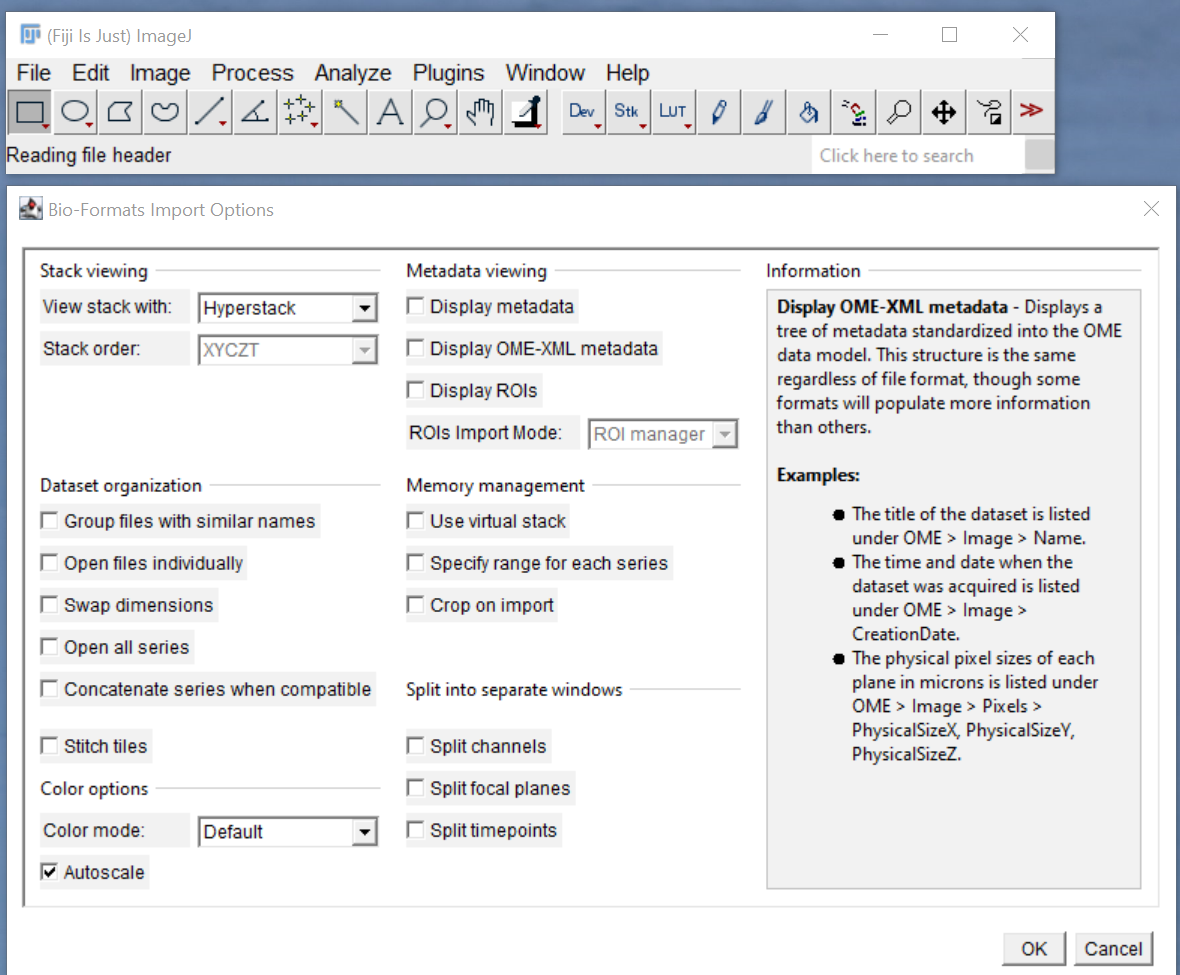
- When you drag the bdv.h5 file in Fiji this window will appear:
- Click ok
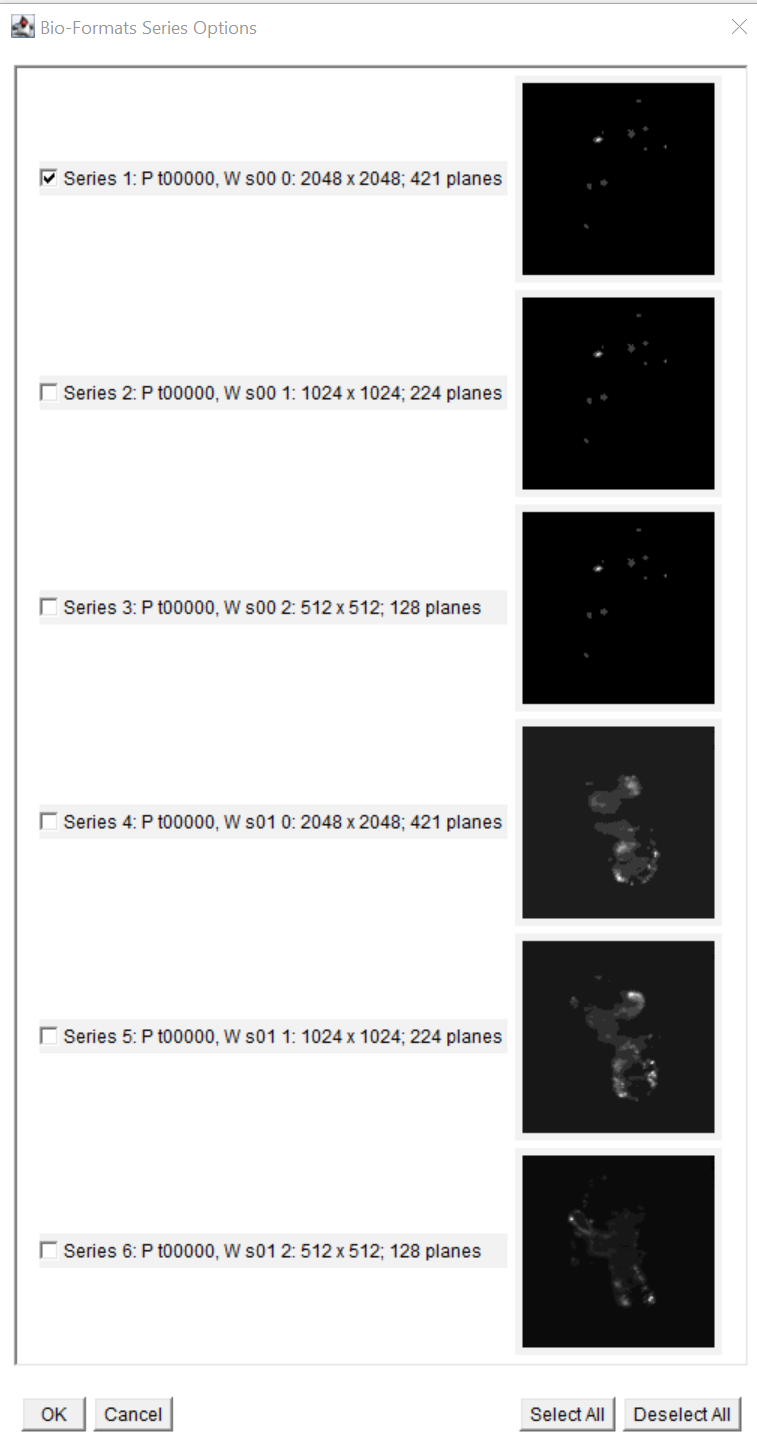
- This selection will appear for a single stack acquired with two channels:
- Series 1 and Series 4 are channel 1 and 2 in full resolution. You should select them both or one at a time to visualize the data in full resolution. Series 2, 3, 5 and 6 are lower resolution versions of the data in the two channels.


