Data Visualization Tools
This book presents some open source options for Data visualization
- Fiji plugin for annotating movies with custom arrows
- Napari
- PetaKit5D
- CLIJ: GPU-accelerated image processing for everyone
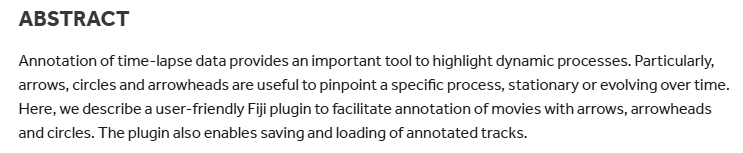
Fiji plugin for annotating movies with custom arrows
Original work by Stefan Daetwyler, Carl D. Modes and Reto Fiolka.
References and example
The Fiji plugin for annotating movies with custom arrows was developed by Stephan Daetwyler, Carl D.Modes and Reto Fiolka at UT SouthWestern.
To read about it and acknowledge the authors, please refer to this publication.

Plugin installation
Complete instructions for plugin installation can be found in this publication.
The GitHub page with the source code can be found here.
Here is a Youtube video with a tutorial to install and use the plugin.
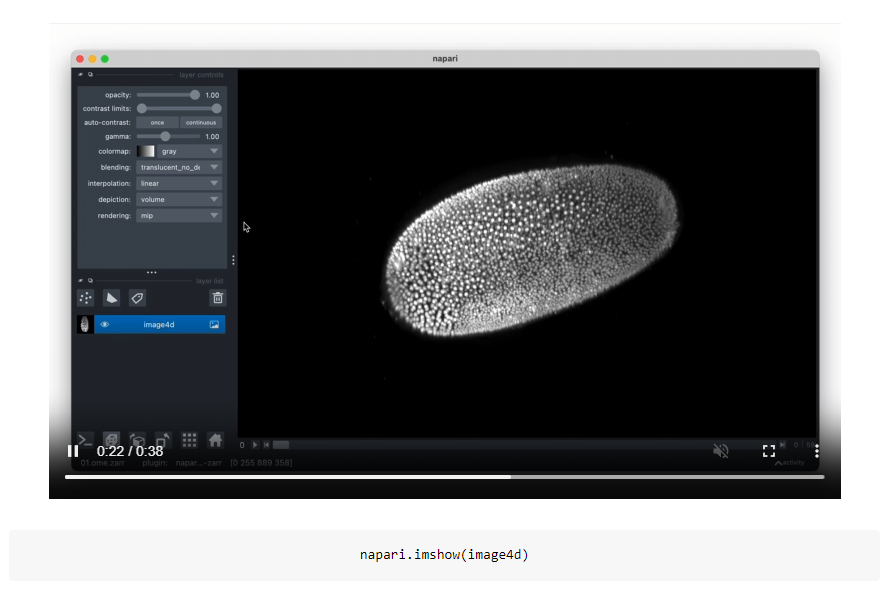
Napari
Napari: a fast, interactive viewer for multi-dimensional images in Python
If you are using Python for image analysis already, Napari is a great package to help you visualize and render your data!
Documentation and downloads can be found on this page.
Below is an example of 3D rendering in Napari.
Napari offers a lot of usage options such as the ones listed below.
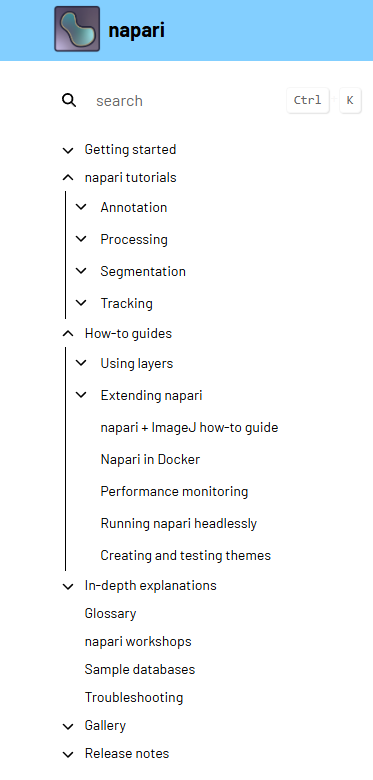
The Gallery gives examples of what you can do in terms of basic and advanced visualization. Check out the examples and see if you can use some of these tools to make awesome images and renderings for your papers and talks!
